
Visual disability is one of the most miserable disabilities that a man can have. It affects an individual’s overall well-being including emotional and social relationships.6 Visual impairment is known to have a negative health outcomes and poor quality of life.7 In this article we are discussing about the visual impairment – low vision and blindness, their causes, economic burden of this visual impairment, barriers to the low vision services and possible strategies to overcome them.
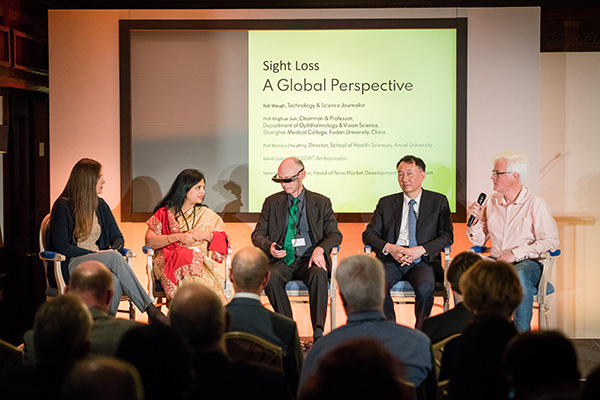
University, India, highlighted the clinical community’s lack of understanding and the availability of new technology for patients with low vision.She has set up a Centre of excellence _Sushant Oxsight centre for sight enhancement at the campus for patients also who need low vision service. (OXSIGHT – TAJ Hotel, London. – 28th February 2019)
Visual impairment and current estimates
According to the International Statistical Classification of Diseases (ICD-10), visual impairment is defined as best corrected visual acuity of less than 6/18 in the better eye. It can be classified as low vision and blindness. The term ‘low vision’ is used for visual acuity less than 6/18 and better than or equal to 3/60 after refractive correction, which includes treatable causes such as cataract and otherswhereas a person is said to be ‘blind’ if his best corrected visual acuity in the better eye is less than 3/60 or central field of 10° or less .1
As per the global estimates of 2010, the total number of visually impaired in the world are 285 million out of which 246 million were in low vision category and 39 million were blind. In India, 62 million people are visually impaired which consist of 21% of total visual impairment. Out of these 62 million, 54 million were found in the category of low vision and 8 million were blind2.65% and 82% of visually impaired and blind, respectively are aged 50 years or above.In 2015, the global population was recorded as 7.33 billion, of this 36.0 million were blind with 56% of females and 44% of males.3
Causes of visual impairment: low vision and blindness
The leading cause of global visual impairment are uncorrected refractive error 43% and cataract 33%. Glaucoma 2%, age-related macular degeneration 1%, diabetic retinopathy 1%, trachoma 1% and corneal opacities 1%. The leading causes of blindness are cataract 51% and glaucoma 8% followed by age-related macular degeneration 5%, childhood blindness 4%, corneal opacities 4%, uncorrected refractive errors 3%, trachoma 3%, and diabetic retinopathy 1%.Around 18% and 21% of the causes of visual impairment and blindness, respectively remains undetermined.2
As per the National Programme for Control of Blindness, India, the causes of blindness are cataract 62.6%, uncorrected refractive error 19.7%, glaucoma 5.80%, posterior segment disorder 4.70%,surgical complications 1.20%, corneal blindness 0.90%, posterior capsule opacification 0.90%and others 4.19%. Estimated national prevalence of low vision and low vision is 0.80per thousand.4
According to an unpublished survey, most common causes of low vision in India are retinitis pigmentosa (36.2%), age-related macular degeneration (16.6%), diabetic retinopathy (15.9%) and glaucoma (10.0%). Albinism (6.6%), nystagmus (4.8%), optic atrophy (2.8%) are other common causes of low vision.
Economic Burden of visual impairment
Direct costs of visual impairment include expenditures for treating the diseases, proving services and other assistive devices. It also consists of time spent in treatment, rehabilitation and training. Indirect costs involve economic output, productivity of the nation and informal care in the form of time spent by family and peers in providing care to the patient which could have been utilized productively. Global burden of visually impaired as estimated for the year 2010 is USD 3.0 trillion with 118 million Disability-adjusted life years (DALYs). This is expected to increase to USD 3.5 trillion and 150 million DALYs by 2020.5
Barriers to low vision services
Challenges faced in providing services to the visually impaired must be understood from both patient’s and eye care practitioner’s prospective. barriers from patient can be because of lack in confidence and poor motivation by peers and family. Low vison service centres are not in reach to majority of the patients. Prescribed devices appear expensive and not cosmetically acceptable by some. The most common barriers for the practitioners in providing low vision services include lack of awareness, lack of training, poor motivation and interest, time consuming workups and difficulty in satisfying patient’s expectations. Other common barriers are lack of availability of devices, lack of man-power and more work load.
Conclusion :
Uplifting the current low vision services
Understanding these barriers for patient in accepting the low vision services and for a practitioner in providing the services can help in improving the current services. Creating awareness among practitioners and among public is important to enhance the current services. More training sessions for the professionals andmain-streaming low vision course in the academic curriculum can help in increasing practitioner’s interest I providing these services. Making the devices readily available and central and state government schemes to decrease the costs of these devices can help in overcoming barriers to patient in device acceptance.
References
1. Revision of visual impairment definitions in the International Statistical Classification of Diseases Lalit Dandona* and Rakhi Dandona/BMC Medicine 2006,4:7.
2. Pascolini D &Mariotti SP. Global Estimates of Visual Impairment 2010. Br J Ophthalmol2012;96:614e618
3. Bourne R A Rupert et al. Magnitude, temporal trends, and projections of the global prevalence of blindness and distance and near vision impairment: a systematic review and meta-analysis. Lancet Glob Health 2017; 5: e888–97(5) e888
4. National Programme for Control of Blindness, India. www.npcb.nic.in
5. Gordois, A. et al. (2012). An estimation of the worldwide economic and health burden of visual impairment. Global public health, 7(5), 465-481
6. Ecosse Lamoureux and Konrad Pesudovs (2011). Vision-Specific Quality-of-Life Research: A Need to Improve the Quality. American journal of ophthalmology. DOI: https://doi.org/10.1016/j.ajo.2010.09.020
7. Maaike Langelaan,Michiel R. de Boer,Ruth M. A. van Nispen,Bill Wouters,Annette C. Moll &Ger H. M. B. van Rens (2007). Impact of Visual Impairment on Quality of Life: A Comparison With Quality of Life in the General Population and With Other Chronic Conditions. Opthalmic Epidemiology.